HRV Tracker
Analyze your heart rate variability with SDNN and RMSSD metrics, understand your recovery and optimize your health every day.
100% Free — No Ads — No Subscription
Analyze your heart rate variability with SDNN and RMSSD metrics, understand your recovery and optimize your health every day.
100% Free — No Ads — No Subscription
A seamless experience across all your Apple devices

Everything you need to understand your HRV
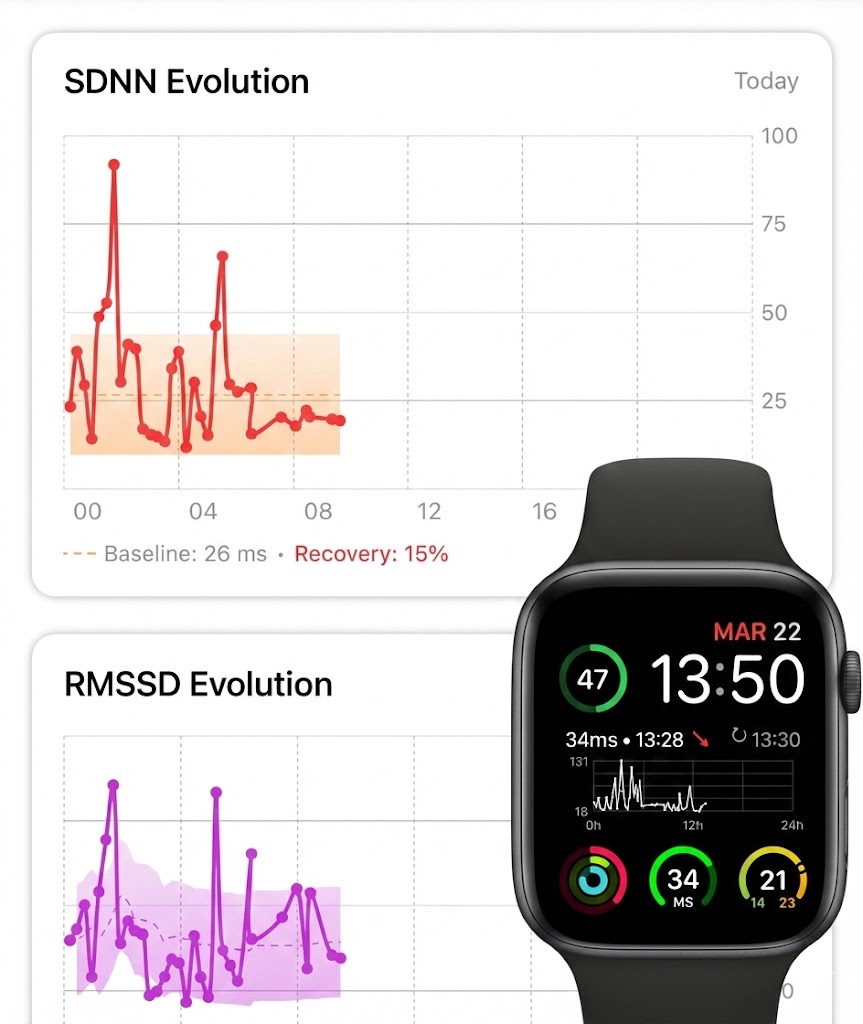
Track both SDNN and RMSSD with dedicated interactive charts, baselines and recovery scores for each metric.
Beat-to-beat variability computed from raw RR intervals for precise parasympathetic nervous system monitoring.
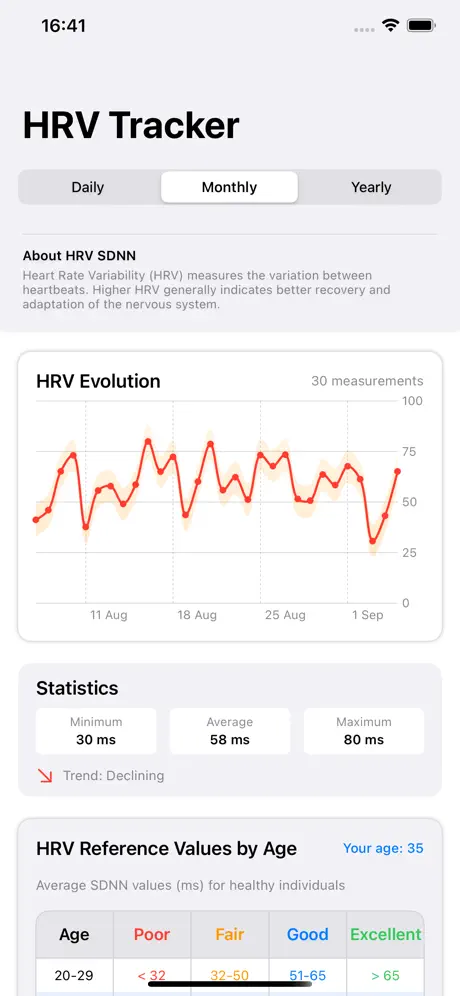
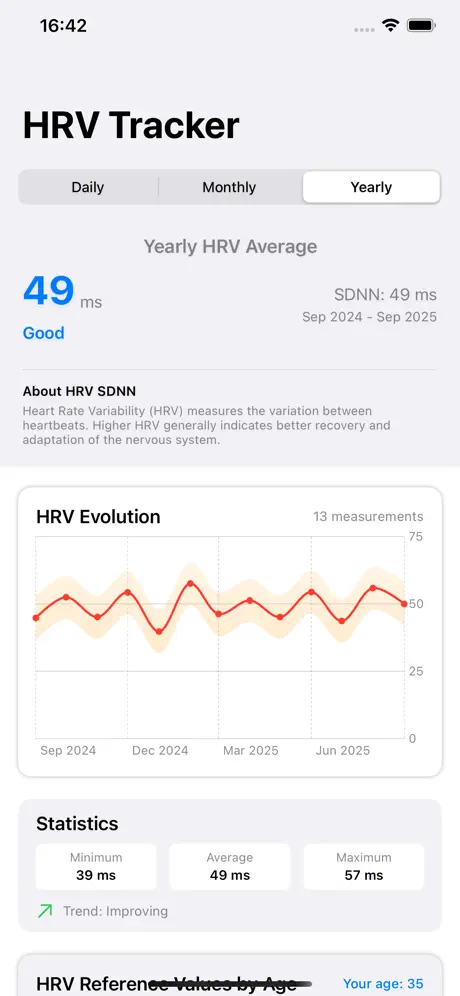
Minimum, average, maximum and trends. Understand how your HRV evolves over time with daily, monthly and yearly views.
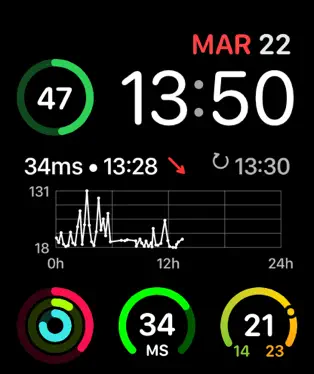
Dedicated Watch app with SDNN and RMSSD complications — live charts, recovery gauges and trend indicators on your watch face.
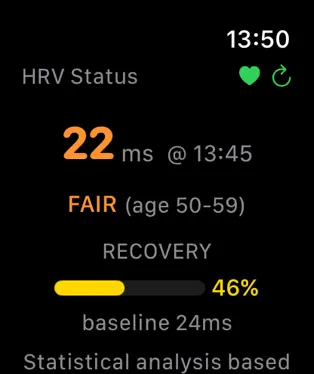
5 zones based on Z-score statistical analysis of your personal baseline to assess your recovery level.
Personalized HRV and RMSSD references based on your age group from scientific literature.
Based on Z-score statistical analysis of your personal baseline
Z-score > +1.5 — Your body is fully recovered and ready for intense effort
Z-score +0.5 to +1.5 — Recovery above your baseline
Z-score -0.5 to +0.5 — Normal recovery level for you
Z-score -1.5 to -0.5 — Recovery below your normal
Z-score < -1.5 — Rest recommended, avoid intense effort
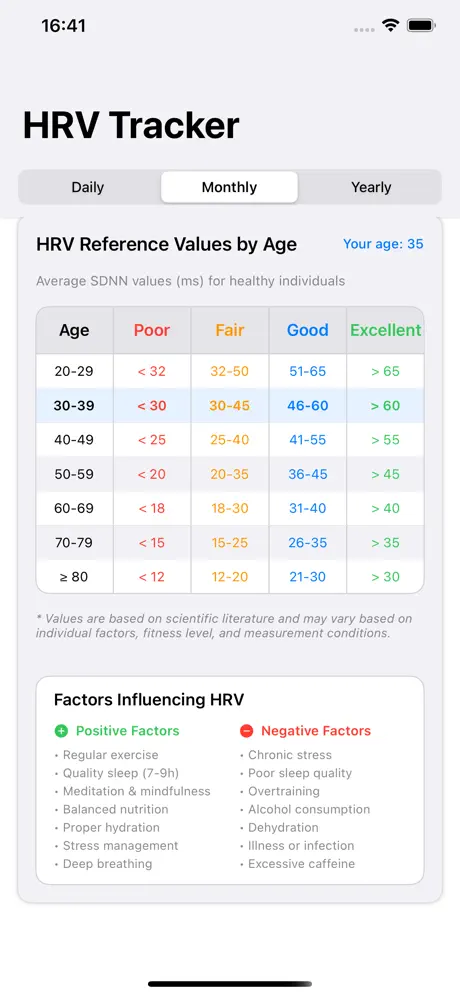
Average SDNN values (ms) for healthy individuals
| Age | Poor | Fair | Good | Excellent |
|---|---|---|---|---|
| 20-29 | < 32 | 32-50 | 51-65 | > 65 |
| 30-39 | < 30 | 30-45 | 46-60 | > 60 |
| 40-49 | < 25 | 25-40 | 41-55 | > 55 |
| 50-59 | < 20 | 20-35 | 36-45 | > 45 |
| 60-69 | < 18 | 18-30 | 31-40 | > 40 |
| 70-79 | < 15 | 15-25 | 26-35 | > 35 |
| ≥ 80 | < 12 | 12-20 | 21-30 | > 30 |